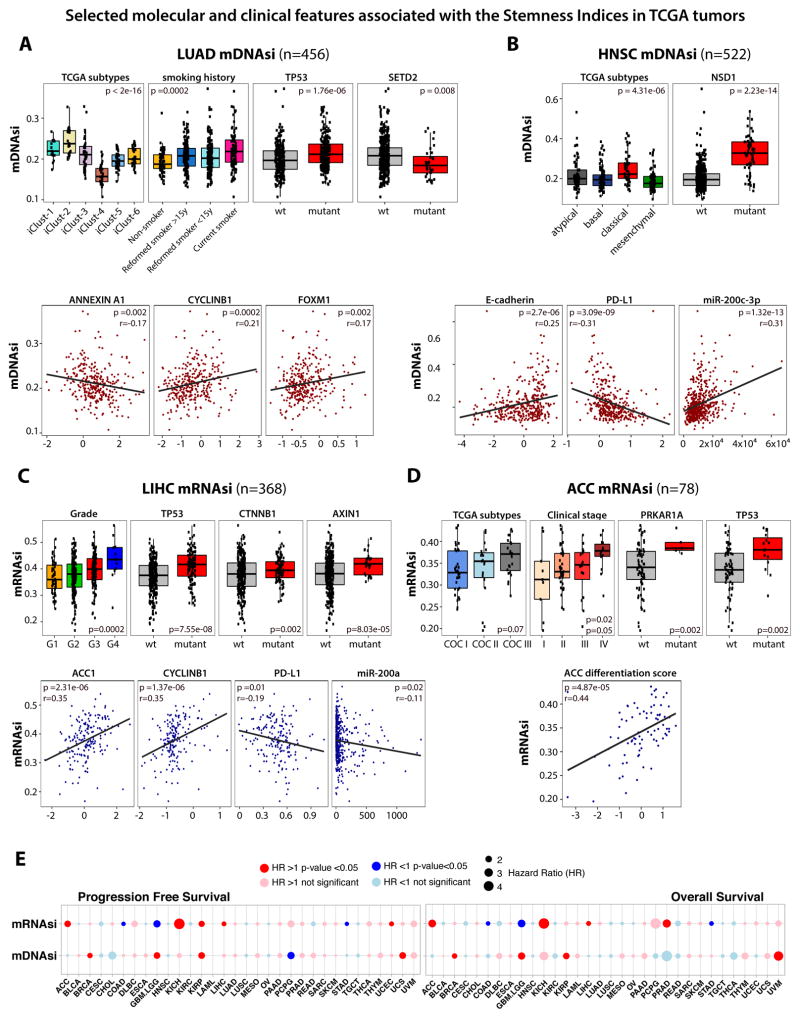
Figure 4. Selected molecular and clinical features associated with the Stemness Indices in TCGA tumors.
(A) Association of molecular and clinical features with stemness in LUAD. Top, mDNAsi by integrative molecular subtypes, smoking history, and mutations of TP53 and SETD2. Bottom, correlation scores of mDNAsi and representative protein expression.
(B) Stemness in HNSC. Top, mDNAsi stratified by molecular subtypes and mutation of NSD1. Bottom, correlation scores of mDNAsi and representative protein and microRNA expression.
(C) Stemness in LIHC. Top, mRNAsi stratified by grade and mutations of TP53, CTNNB1, and AXIN1. Bottom, correlation scores of mRNAsi and representative protein and microRNA expression.
(D) Stemness in ACC. Top, mRNAsi stratified by mRNA molecular subtypes, clinical stage, and mutations of PRKAR1A and TP53. Bottom, correlation scores of mRNAsi and adrenal differentiation score.
(E) Cox proportional hazards model analysis. Left, progression-free survival; right, overall survival. Hazard ratio greater than one denotes a trend toward higher stemness index with worse outcome.
See also Figures S3, S4, and S5.

