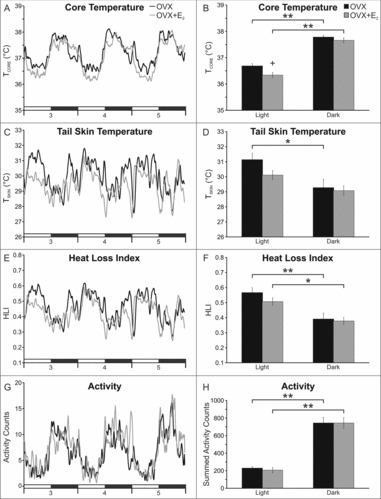
Figure 3.

E2 treatment of OVX mice reduces TCORE during the light phase (A, B) with no significant effect on TSKIN (C, D), heat loss index (E, F) or activity (G, H). The line graphs (left) show the mean values for each group 3 to 5 days after E2 treatment. The lines are generated with a moving average of 5 points and the black bars on the X axis denote the dark phase. The bar graphs (right) show data analysis (mean ± SEM) from days 3–5. Light vs dark phase differences were identified (B, D, F, H), except for TSKIN in the OVX + E2 group (D). Unlike previous studies in the rat, E2 did not decrease TSKIN or HLI in the dark phase. n = 9 – 10 mice/group, + Significantly different OVX vs OVX + E2, p = 0.02, * Significantly different light vs dark within treatment group, p < 0.01, ** Significantly different light vs dark within treatment group, p < 0.001.
