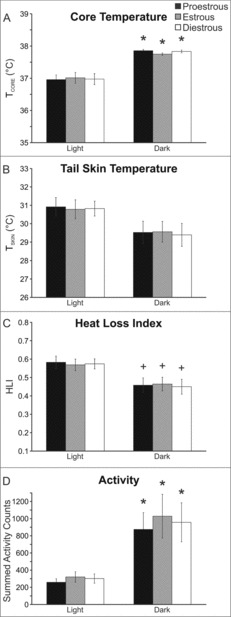
Figure 5.

Average TCORE (A), TSKIN (B), heat loss index (C) and activity (D) during the estrous cycle of the mouse. Circadian rhythms were observed but there was no effect of the phase of the estrous cycle. Values represent mean ± SEM, n = 16 cycles averaged from 6 mice. + Significantly different than light phase p < 0.05, * Significantly different than light phase p < 0.01.
