
Figure 5.
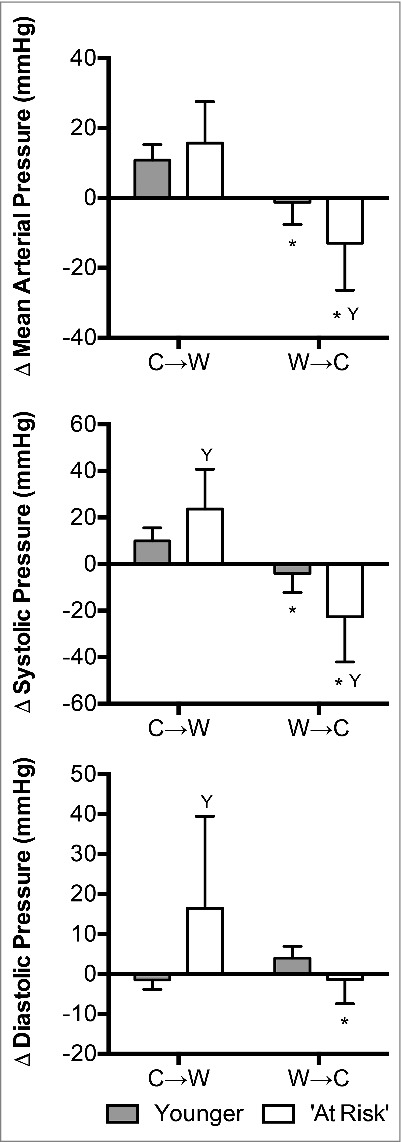
Changes (Δ) in mean arterial pressure, systolic pressure and diastolic pressure upon the decision to move from cool-to-warm (C→W) and from warm-to-cool (W→C) in younger adults (n = 12) and ‘at risk’ older adults (n = 6). Mean ± SD, * different from C→W (P < 0.01), Y different from younger (P ≤ 0.05).