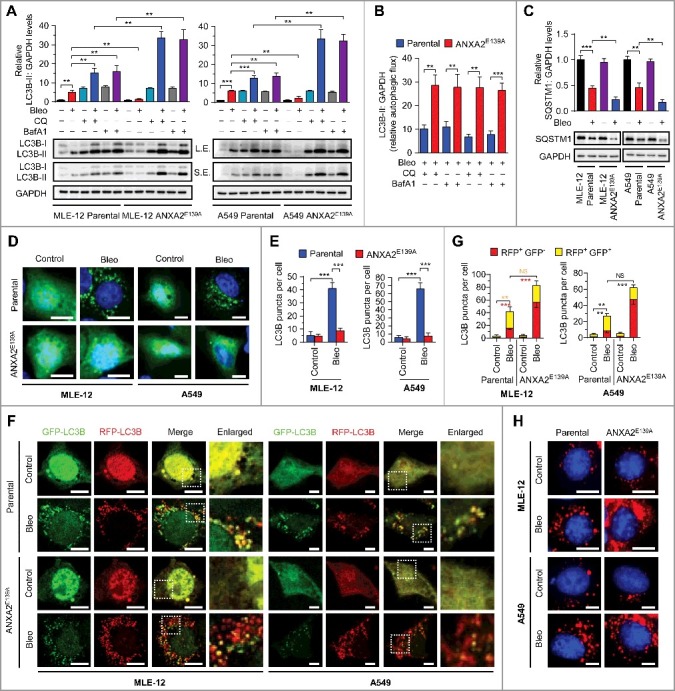
Figure 4.

Disruption of bleomycin-ANXA2 interaction accelerates autophagic flux in lung epithelial cells. (A) Immunoblots for LC3B in parental and ANXA2E139A cells treated with bleomycin (50 μM) or cotreated with chloroquine (CQ, 20 μM) or bafilomycin A1 (BafA1, 100 nM) for 24 h. GAPDH, loading control. S.E., short exposure; L.E., long exposure. Quantification of LC3B levels in parental and ANXA2E139A cells treated with or without bleomycin is shown. (B) LC3B-II:GAPDH levels in parental and ANXA2E139A cells treated with bleomycin in the presence of CQ or BafA1 shown in (A). LC3B-II:GAPDH was calculated as: (LC3B-II level treated with bleomycin combined with CQ or BafA1 − LC3B-II level treated with bleomycin alone) ÷ LC3B-II basal levels. (C) Immunoblots for SQSTM1 in parental and ANXA2E139A cells treated with or without bleomycin (50 μM). GAPDH, loading control. Quantification of SQSTM1 levels is shown. (D) Representative images of parental or ANXA2E139A cells transiently expressing GFP-LC3B plasmids followed by bleomycin (Bleo, 50 μΜ) treatment for 24 h. DNA was counterstained with Hoechst 33342 (blue). Scale bars: 10 μm. (E) Quantification of LC3B puncta shown in (D). (F) Representative images of parental or ANXA2E139A cells transiently expressing mRFP-GFP-LC3B plasmids followed by treatment with bleomycin (50 μM) for 24 h. Scale bars: 10 μm. (G) Quantification of LC3B puncta shown in (F). (H) Representative images of parental or ANXA2E139A cells incubated with BODIPY-conjugated bovine serum (DQ-BSA, red) followed by bleomycin treatment (50 μΜ) for 24 h. DNA was counterstained with Hoechst 33342 (blue). Scale bars: 10 μm. Data in (B, D, F and H) are means ± s.d., Results are representative of 3 independent experiments. *P < 0.05, **P < 0.01, ***P < 0.001 (Student t test). NS, nonsignificant.
