Figure 1.

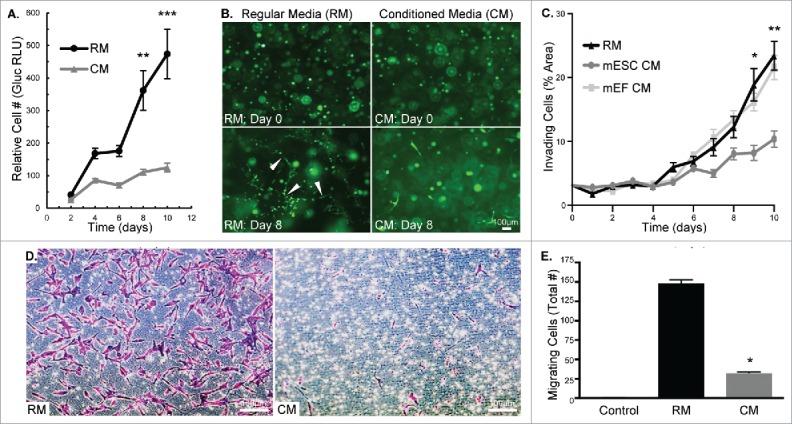
MDA-MB-231 cells treated with mESC CM display decreased proliferation, invasion, and migration. (A) MDA-MB-231-Gluc cells were cultured in 2D for 10 d in either RM or CM with media change and Gluc measurement occurring every 2 d to quantify proliferation. (B) MDA-MB-231-GFP cells were embedded in Matrigel and treated with RM or CM over a period of 10 d. Images were captured every 2 d to monitor morphological differences. White arrows indicate tubular structures. (C) Cell invasion was compared between RM, mESC CM and mEF CM treated MDA-MB-231 cells by measuring percent of area invaded by cells embedded in Matrigel over a period of 10 d. Phase contrast images were captured daily and area was quantified using Image J. (D) Representative images of crystal violet stained MDA-MB-231 cells after 24 hr migration period through transwell membranes. (E) MDA-MB-231 cells were pre-treated with RM or mESC CM and cell migration was assessed using a transwell migration assay. Control transwell inserts absent of cells showed no staining. Error bars indicate standard error and statistical significance indicated by * for p<0.05, ** for p<0.005, and *** for p<0.0005. Scale bars are 100 μm.
