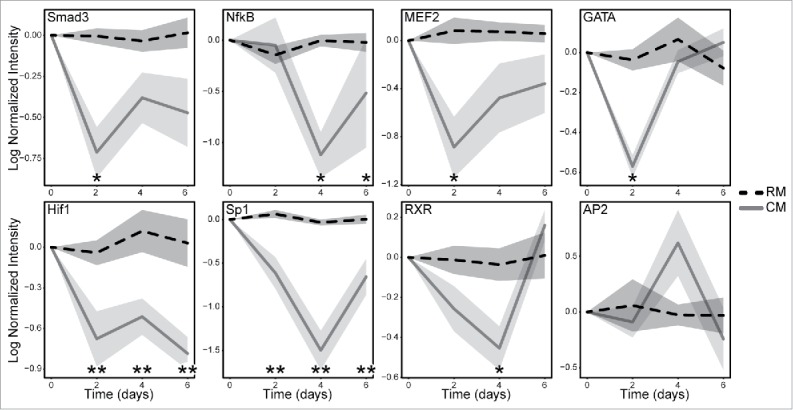
Figure 4.

MDA-MB-231 cells treated with mESC CM display altered activity of multiple TFs. MDA-MB-231 cells were infected with the TF specific reporter and encapsulated in Matrigel prior to plating in a 384 well plate. BLI was used to obtain a day 0 baseline reading prior to conditioning. The cells were then treated with RM or mESC CM every 2 d for 6 d. BLI was measure every 2 d to quantify TF activity and dynamics over a period of 6 d. Cell activity following RM (dashed black line) and mESC CM (solid gray line) treatments are shown normalized to TA lentiviral activity, which correlates with cell number, and is shown with standard error bars. Statistical significance indicated along x-axis by * for p<0.05 and ** for p<0.005. Technical replicates of 4 for each TF reporter; biological replicates of 2 for Hif1, MEF2, GATA, and AP2; biological replicates of 3 for Sp1, NF-κΒ, RXR; biological replicate of 4 for Smad3.
