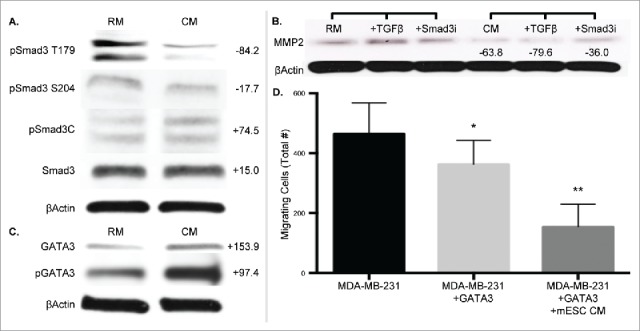
Figure 5.

MDA-MB-231 cells treated with mESC CM display altered protein expression profiles of phospho-Smad3, Smad3-mediated, and GATA3 gene expression. MDA-MB-231 cells were treated with RM or mESC CM for 4 d, after which protein was collected for immunoblotting assays. (A) Smad3 and phospho-Smad3 (T179, S204, C). (B) Cells were also treated with RM or mESC CM alone, or with the addition of TGFβ or a Smad3 inhibitor SIS3, followed by protein extraction and immunoblotting for MMP2. (C) GATA and phospho-GATA3 expression. (D) Migration potential of MDA-MB-231 cells was assessed after stable overexpression of GATA3 treated with RM or mESC CM. Immunoblots are representative and percent change from RM to CM densitometry is adjacently indicated. Statistical significance indicated by * for p<0.05 and ** for p<0.005.
