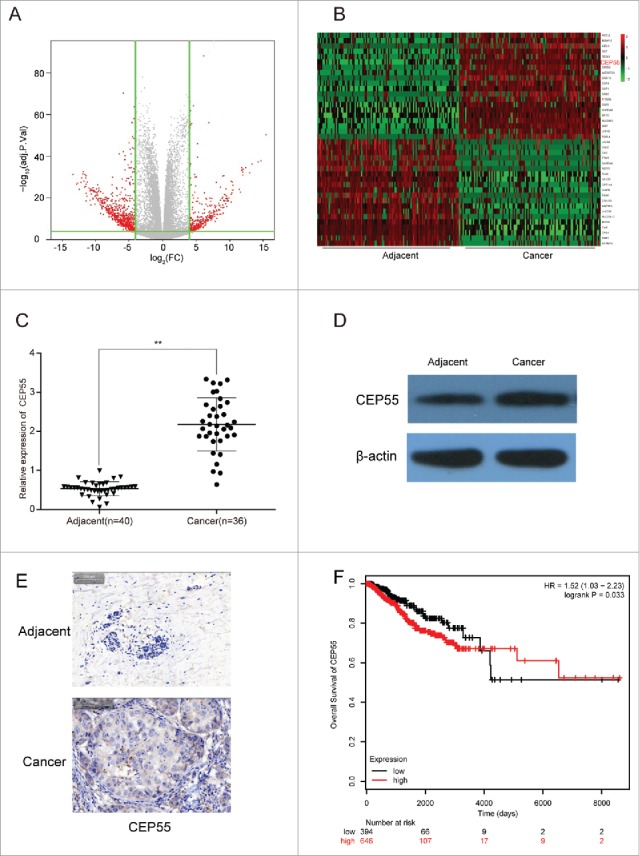
Figure 2.

CEP55 was up-regulated in breast cancer tissues and cells. (A) The volcano plot showed the relationship between fold change and significance of mRNAs expression. (B) The heat map showed the top 20 high-expressed and 20 low-expressed mRNAs in breast cancer. (C) QRT-PCR assay was used to detect the mRNA expression level of CEP55. The results showed that the mRNA expression level of CEP55 in cancer tissues was significantly increased.**P < 0.01, compared with adjacent tissues, number of adjacent tissue = 40, number of cancer tissue = 36. (D-E) Western blot and immunohistochemistry assays were used to detect the protein expression level of CEP55. The results revealed that CEP55 protein expression level was up-regulated in breast cancer tissues and cells. (F) Kaplan-Meier method was used to plot the 5-year survival ratio of breast cancer patients. The plot indicated that patients with high expression level of CEP55 had lower survival ratio, compared with those had low-expressed CEP55.
