
Figure 2.
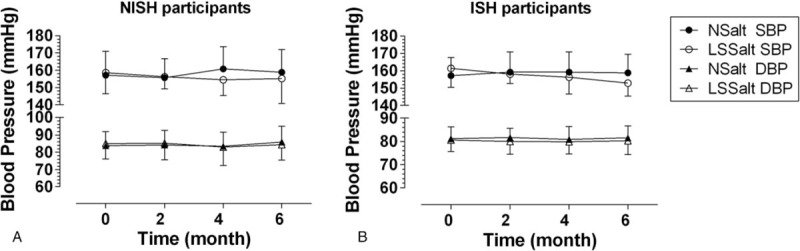
Systolic and diastolic blood pressure changes in ISH and NISH participants after 6 months follow-up. Data are reported as mean ± SD. ISH, isolated systolic hypertension; NISH = nonisolated systolic hypertension; LSSalt = low sodium salt; NSalt = normal salt; SBP = systolic blood pressure; DBP = diastolic blood pressure.