Figure 5.

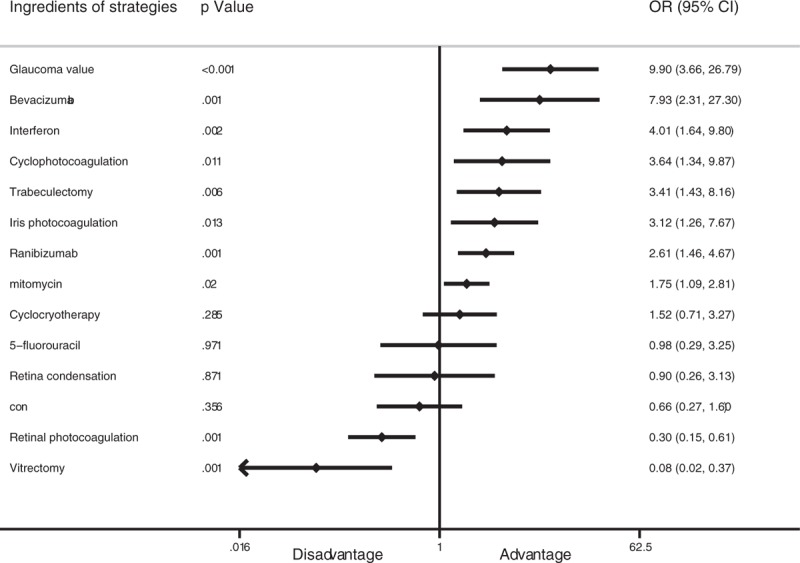
Forest plot of contributions of the different therapeutic strategies to treatment success rate based on the multilevel mixed-effects logistic regression.

Forest plot of contributions of the different therapeutic strategies to treatment success rate based on the multilevel mixed-effects logistic regression.