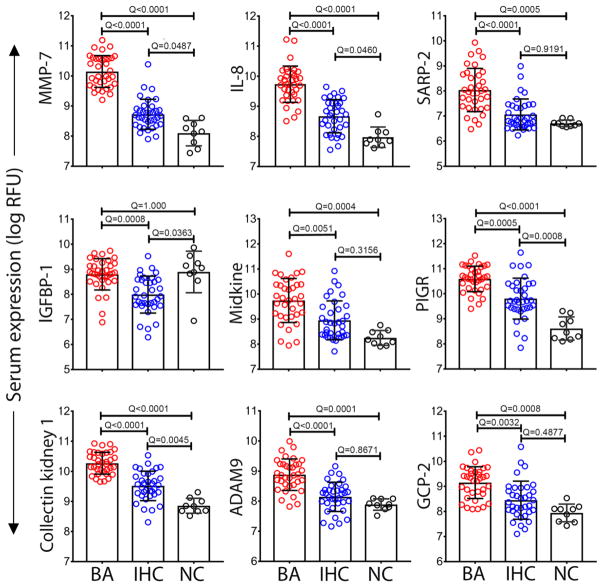
Fig. 2. Top 9 proteins differentially expressed between BA and IHC.
Data from the discovery cohort categorized into biliary atresia (BA, N=35), intrahepatic cholestasis (IHC, N=35), and age-matched normal controls (NC, N=9). Dots represent the log of relative fluorescent unit (RFU) for individual serum proteins. Bars and whiskers represent median and interquartile range. Q-values from ANOVA with multiple hypothesis correction (Benjamini-Hochberg procedure).

