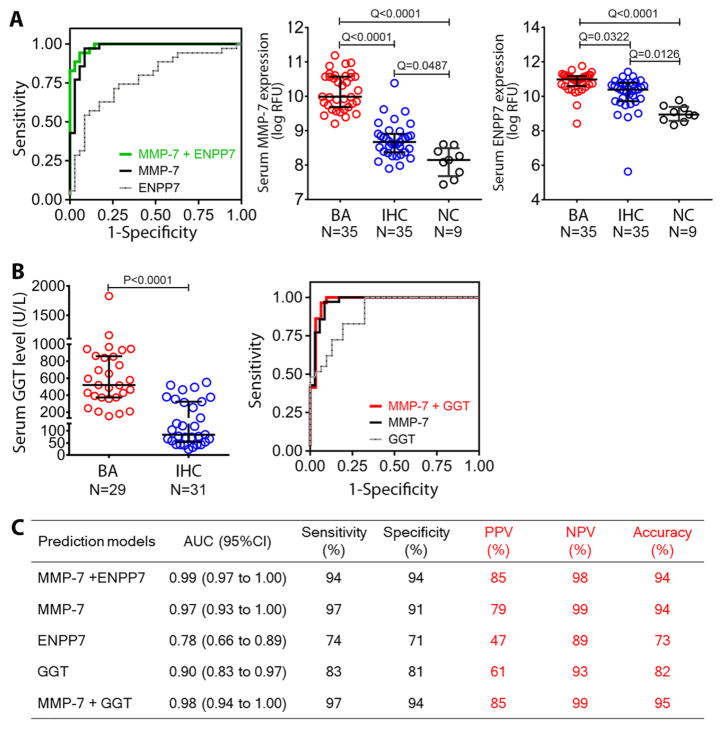
Fig. 3. Predictive features of MMP-7, ENPP7 and GGT for biliary atresia.
(A) ROC curves for serum MMP-7 and/or ENPP7 in distinguishing biliary atresia (BA) from intrahepatic cholestasis (IHC) in multivariable logistic regression analyses and dot plots of the proteins in the discovery cohort. Data are shown as log of relative fluorescent units (RFU); mid horizontal lines and whiskers represent median and interquartile range. (B) Serum GGT levels in subjects with BA and IHC; normal range is 5–59 U/L. The right panel shows ROC curves from MMP-7 and/or GGT. (C) Prediction models for MMP-7, ENPP7 and GGT. Sensitivity, specificity, positive and negative predictive values were calculated at selected optimal cut-off. Q values from ANOVA with multiple hypothesis correction (Benjamini-Hochberg procedure) for (A) and P-value from Mann Whitney test for (B). AUC, area under the ROC curve; NPV, negative predictive value; PPV, positive predictive value; ROC, receiver operating characteristic.

