
Figure 3.
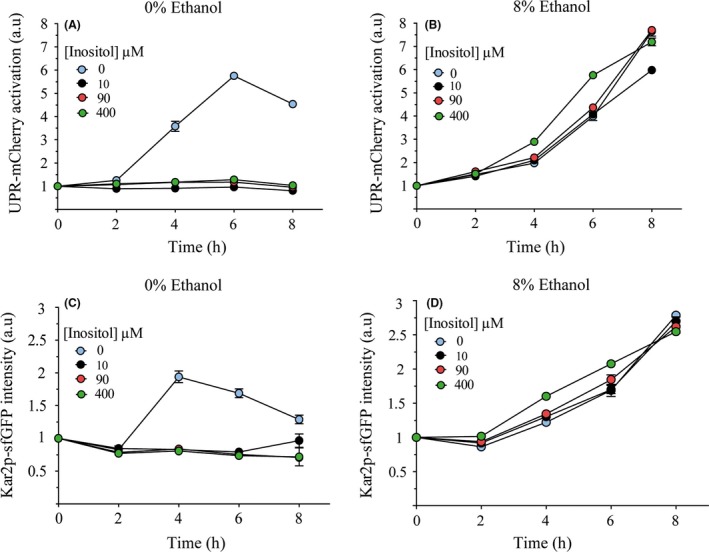
UPR activation dependence on the presence of ethanol stress and inositol content. Cells were exposed to different levels of inositol content (0, 10, 90 and 400 μM) alone (A, C) or with 8% ethanol (B, D). Samples were obtained at different time points. The fluorescence of the UPR‐mCherry (A, B) or Kar2‐sfGPF (C, D) reporters was measured by flow cytometry. The results refer to time point 0 for each condition and reporter and represent the average and standard deviation of three independent biological replicates.