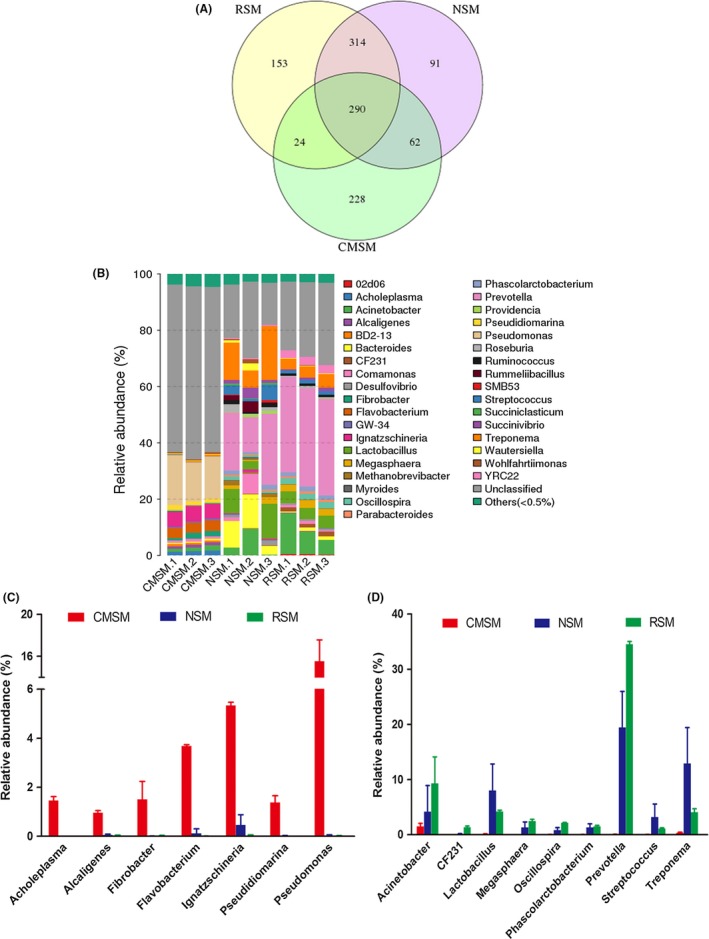
Figure 1.

Comparison of swine manure microbiota. A. Venn diagram of shared OTUs of RSM, NSM and CMSM with 97% similarity.
B. Microbial composition of RSM, NSM and CMSM at the genus level. The top 37 abundant genera are shown by relative abundance of each bacterial genus within a group. C. The increased genera of CMSM compared with RSM. D. The decreased genera of CMSM compared with RSM. Each bar is the mean with SD from three replicates.
