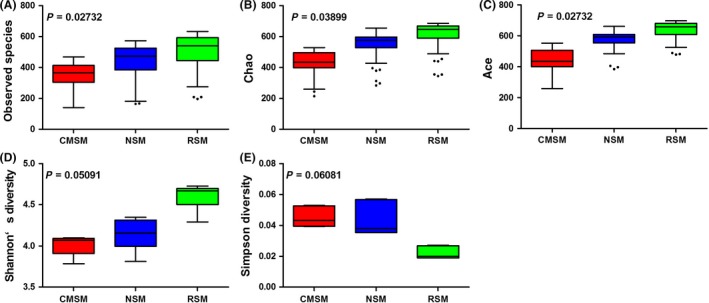
Figure 2.

Alpha diversity analysis of RSM, NSM and CMSM. A. Observed species. B. Chao. C. Ace. D. Shannon's diversity. E. Simpson diversity. The five lines of boxplot from bottom to top are the minimum value, the first quartile, median, the third quartile and the maximum value.
