Figure 4.

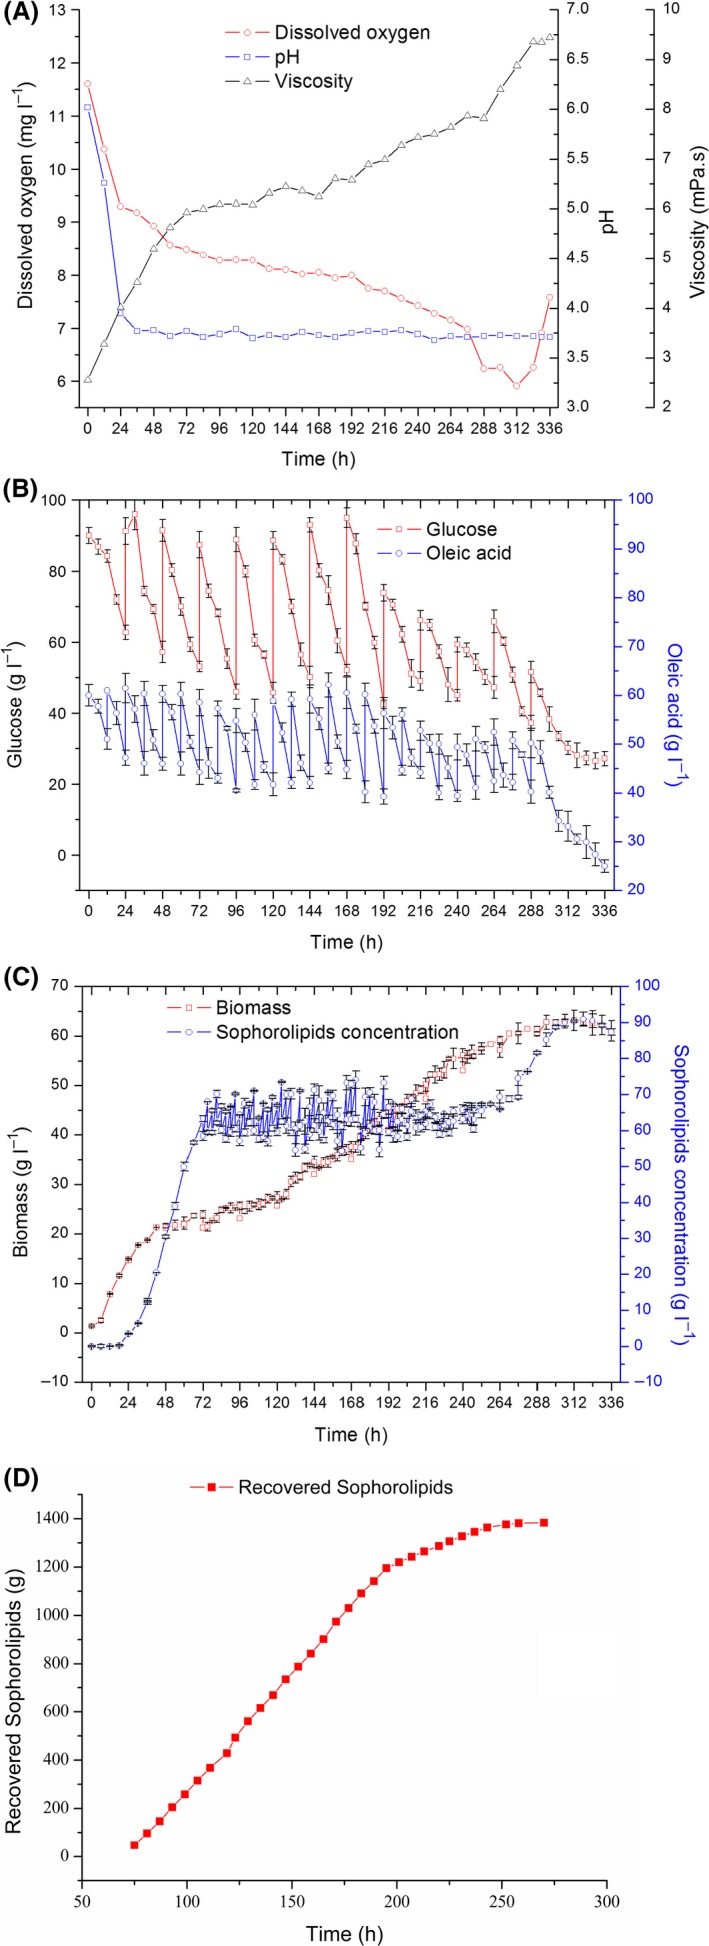
Fermentation curve during semicontinuous fermentation over a 320‐h period.
A. Time‐course of DO, viscosity and pH.
B. Consumption of glucose and oleic acid substrates.
C. Cell growth and SL production.
D. Total quantity of recovered SL. The results shown are the mean values from triplicate experiments.
