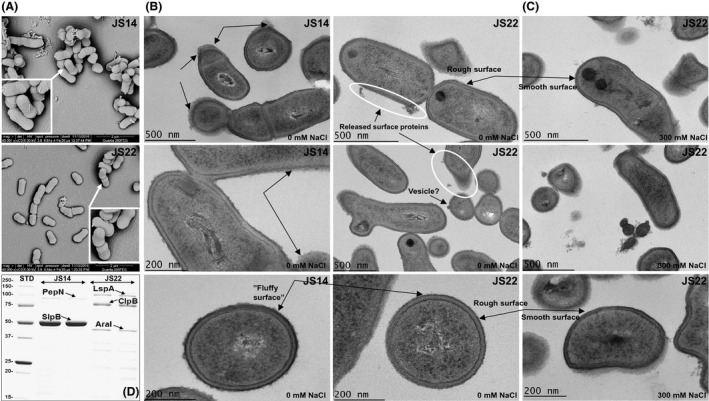
Figure 4.

Electron microscopic and surface analyses of JS14 and JS22. (A) Representative SEM micrographs of JS14 and JS22. SEM analyses revealed the absence of fimbrial adhesins at the cell surface of the indicated cells. Representative TEM micrographs of JS14 and JS22 cells cultured in the absence (B) and presence (C) of 300 mM NaCl. JS14 showed fluffier cell surface compared to JS22 that presented rough and smooth surfaces when cells were propagated in the absence and presence of NaCl respectively. Arrows, potential surface‐associated proteinaceous structures. Circles, released surface‐proteins and the presence of a possible MV. The sizes of scale bars are marked in the images. (D) 1‐DE image of non‐covalently attached surface‐proteins released from JS14 and JS22. The indicated protein bands were identified by in‐gel tryptic digestion and LC‐MS/MS. Proteins with the highest Mascot identification score (P < 0.05) from each protein band are indicated. STD, a molecular weight marker (250–10 kDa) (New England BioLabs).
