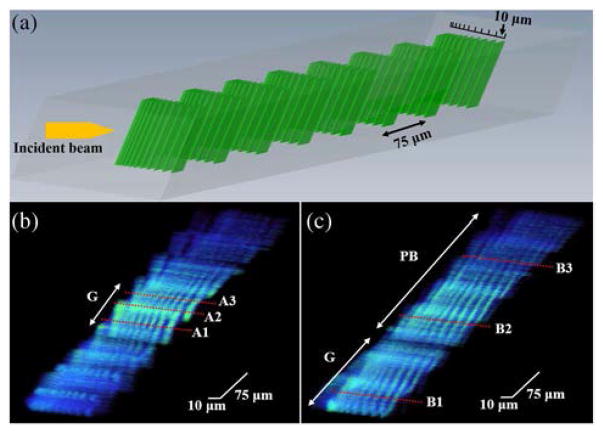
Fig. 4.
(a) 3D schematic drawing of the OCT phantom that has 8 resolution target pattern layers at different depths, spaced by 75 μm. The spacing between bars starts at 10 μm and decrements to 1 μm. (b) A 3D image of the OCT phantom acquired by the conventional fiber optic probe, showing clear resolution of bars over a narrow depth range. A1, A2, and A3 correspond to the depth of 273 μm, 314 μm, and 362 μm, respectively. (c) A 3D image of the OCT phantom acquired by the self-imaging wavefront division fiber optic probe, demonstrating a visualization of bars over the entire phantom. B1, B2, and B3 correspond to the depth of 38 μm, 288 μm, and 463 μm, respectively. G, Gaussian focusing region; PB, pseudo-Bessel focusing region.

