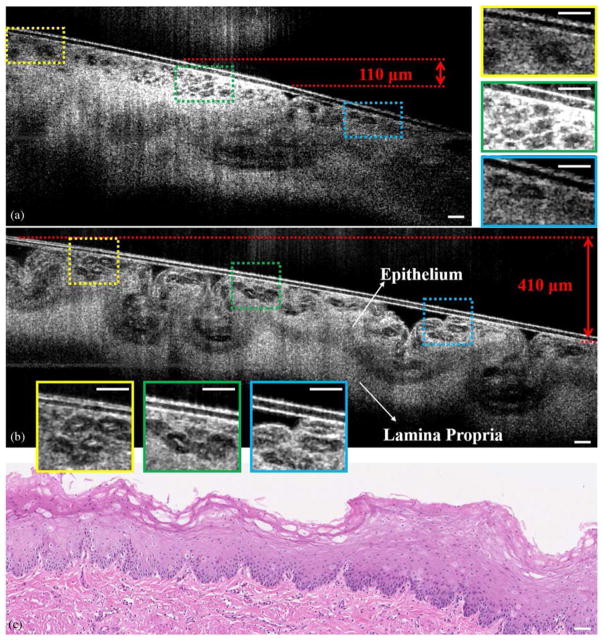
Fig. 5.
(a) Cross-sectional μOCT image of a swine esophagus, obtained with the conventional fiber optic probe ex vivo. The three insets on the right are the magnified images that correspond to the rectangular regions labeled in the image. These insets show that the cells can be clearly visualized in the infocus region, but when it is out of focus, images are consistent with cells but significantly blurred. (b) A cross-sectional μOCT image of the same swine esophagus specimen acquired by the self-imaging wavefront division fiber optic probe ex vivo. The specimen was tilted to introduce a more than 400 μm depth offset for demonstration of the extended DOF. The three insets on the bottom are the magnified images corresponding to the rectangular regions labeled in the image. The insets show that the cells are visualized with high contrast and resolution throughout the extended focal range. (c) The histology of the specimen (H&E). μOCT images were three-frame averaged and spatially filtered by a median filter with a radius of 1.5 μm. Scale bars: 50 μm.

