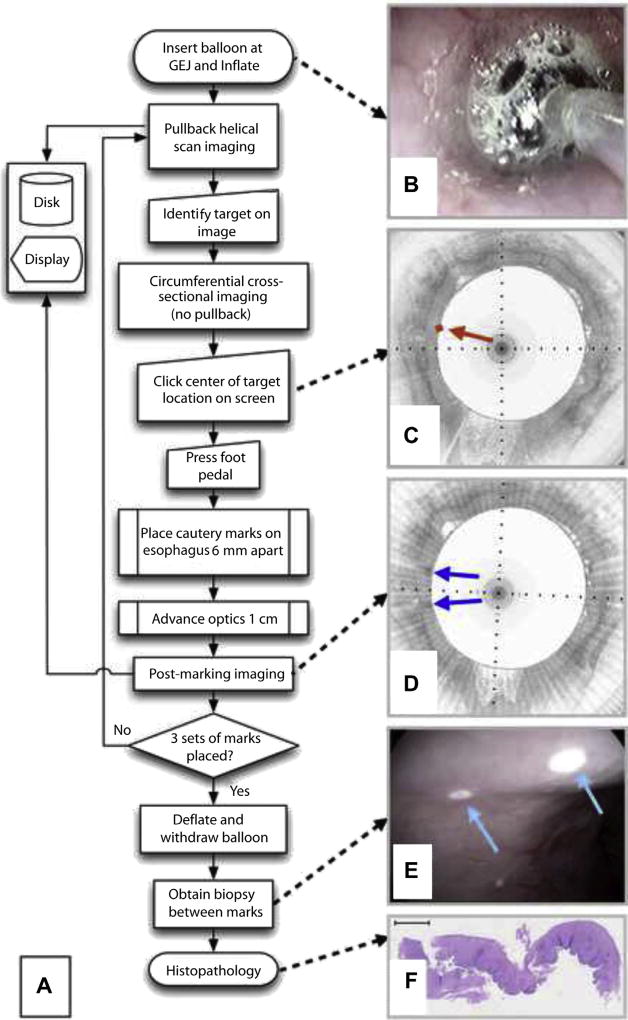
Figure 2.
A, Flow chart of the VLE-guided biopsy procedure. B, Video endoscopy image of the balloon inflated within the esophagus. C, Pre-marking image showing squamous mucosa circumferentially. The center of the intent-to-biopsy site is delineated by a red diamond and arrow. D, Post-marking image in the study aspect ratio demonstrates regions of high optical coherence tomography signal flanking the target region (blue arrows). E, Video endoscopy shows 2 white laser cautery marks (cyan arrows). F, Squamous epithelium is evident in the histology of the biopsy acquired between the marks. VLE, volumetric laser endomicroscopy.

