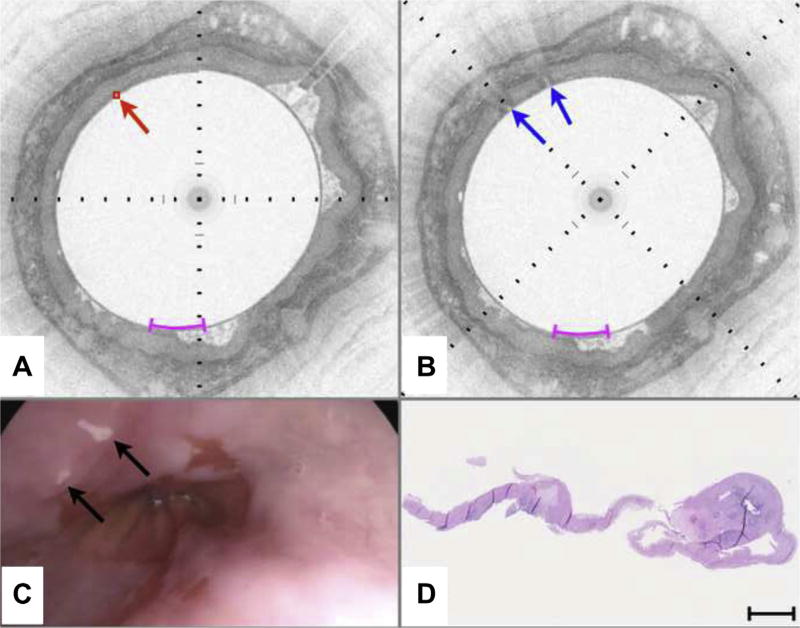
Figure 3.
VLE-guided biopsy of squamous mucosa in vivo. A, Pre-marking image in the study aspect ratio demonstrates that the entire esophageal wall circumference has a layered appearance consistent with squamous mucosa. An intent-to-biopsy site is selected (red box and arrow). B, The post-marking image in the study aspect ratio shows areas of high OCT signal in the squamous epithelium, surrounding the target site. C, Video endoscopy shows the laser cautery marks as focal, bright regions (black arrows) on the esophageal luminal surface. D, Histology from a biopsy excised at the marks shows squamous mucosa. Black tick marks in A and B, 350 µm in depth. Magenta scale bars in A and B, 5 mm along the circumference. Scale bar in D, 500 µm. VLE, volumetric laser endomicroscopy; OCT, optical coherence tomography.

