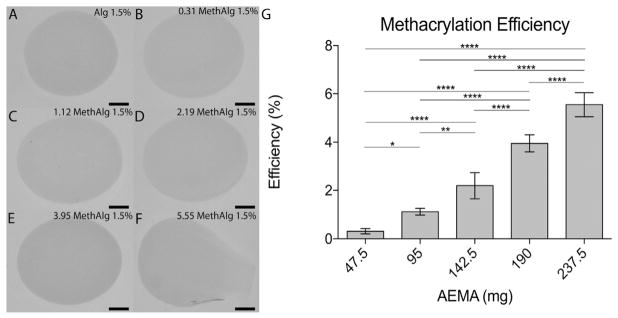
Fig. 3.
Microbead formation depends on methacrylation efficiency which varies with AEMA mass. Alginate microbeads (1.5% w/v) formed from A) 0 (control), B) 47.5, C) 95, D) 142.5, E) 190, and F) 237.5 mg AEMA G) Methacrylation efficiency determined from hNMR plotted versus mass of AEMA. *p ≤.05, **p ≤ .01, ****p ≤ .0001. Scale bar represents 500 μm.

