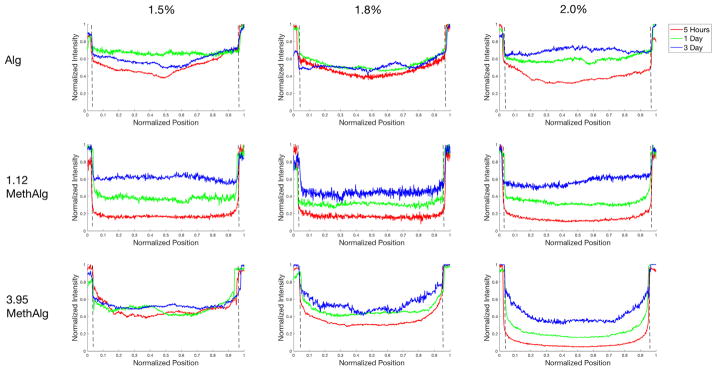
Fig. 7.
Intensity profiles of a cross section of alginate microbeads incubated fluorescently labeled BSA at 5 h, 1 day, and 3 days. The BSA was present within the core of the microbeads at 5 h for all groups with varying levels of intensity. The dashed line represents the margins of the beads. Data from a representative microbead is shown for each condition.

