
Figure 3.
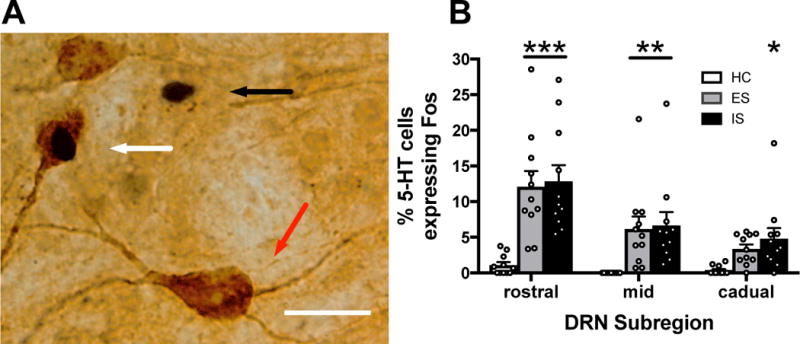
No effect of stressor controllability on DRN activation. (A) A representative brightfield photomicrograph showing a Fos-immunoreactive (ir) nucleus (black arrow), a 5-HT-ir soma (red arrow) and a double-labeled (Fos and 5-HT) neuron (white arrow) in the DRN following tail shock. (B) Percentage of 5-HT-labeled cells expressing Fos in rostral, middle, and caudal regions of the DRN for escapable shock (ES), inescapable shock (IS), or home cage control (HC) groups. Bar graphs represent mean (± SEM), *p < 0.05, **p < 0.01, ***p < 0.001 compared to HC. Scale bar represents 25 μm.