
Figure 4.
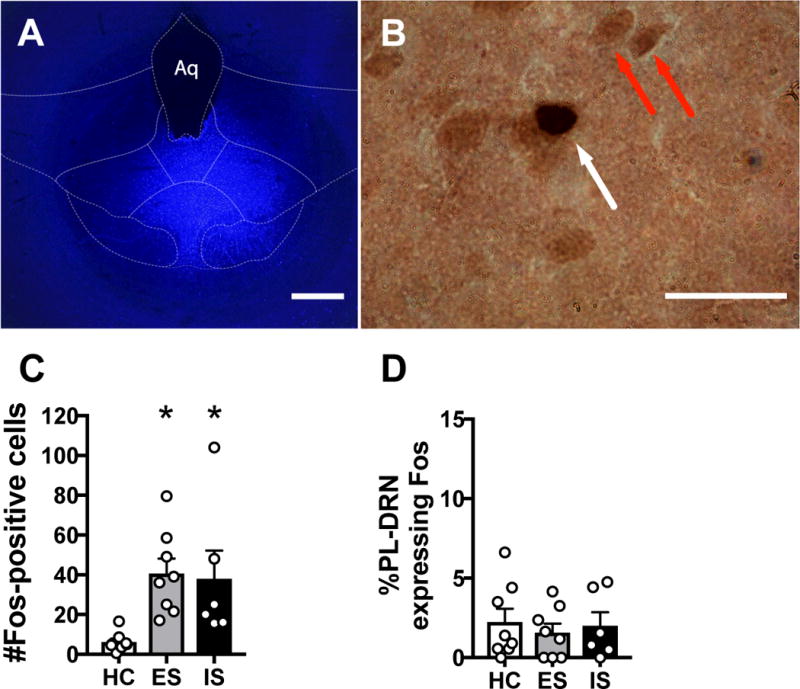
Behavioral control does not activate the PL to DRN pathway. (A) Fluorescent photomicrograph showing a representative fluorogold (FG) deposit in the DRN. (B) Representative brightfield photomicrograph showing a FG-immunoreactive (ir) soma (red arrow) and a double-labeled (FG and Fos) neuron (white arrow) in the PL following tail shock. (C) Total number of Fos-positive cells in the PL. (D) Percentage of FG-ir neurons expressing Fos in the PL following escapable shock (ES), inescapable shock (IS), or home cage control (HC). Bar graphs represent mean ± SEM, *p < 0.05 compared to HC. Scale bars represent 500 μm in A and 25 μm in B.