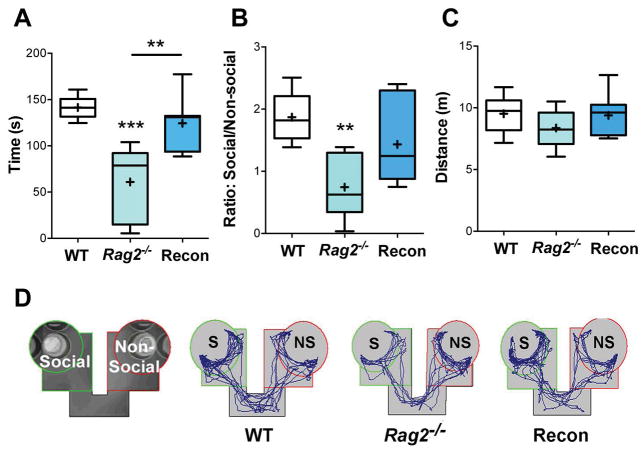
Fig. 2. Social interaction.
A) Time spent in close proximity (green circle) to the conspecific mouse, p < 0.001. B) Social interaction score (ratio of time in the social arena to the non-social arena), p = 0.004. C) Distance traveled during the test showed no significant difference. D) Representative images of the social interaction test. ANOVA with Tukey post hoc test for all analyses. WT: n = 6, Rag2−/−: n = 8, Recon: n = 7. ** p ≤ 0.01, *** p ≤ 0.001.

