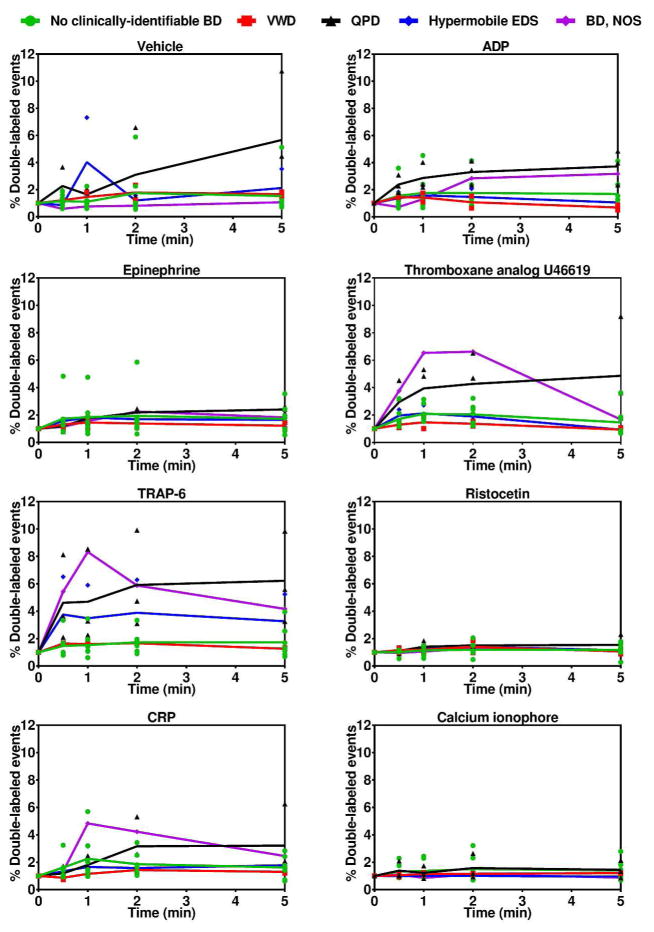
Figure 3.
Platelet aggregation for the study cohort. Individual participant results are plotted as symbols and the mean averages for each agonist condition per diagnosis are connected by lines. The symbols and lines are color-coded by diagnosis: green indicates no clinically-identifiable BD; red indicates VWD; black indicates QPD; blue indicates hypermobile EDS; and purple indicates BD, NOS.

