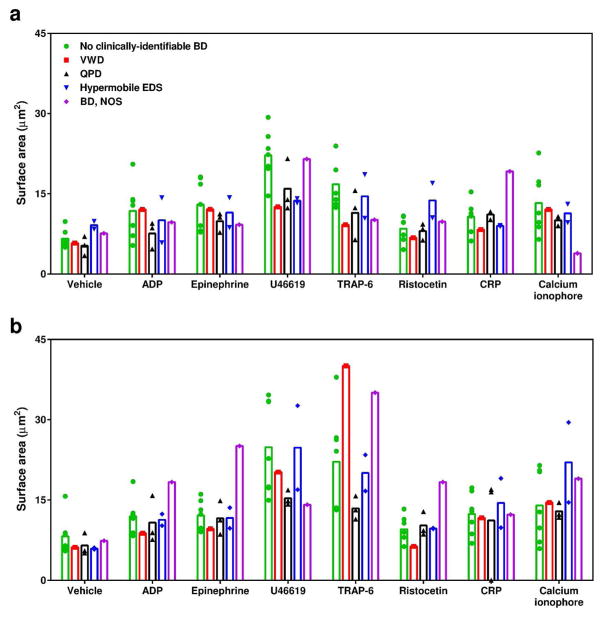
Figure 4.
Platelet adhesion and spreading for study cohort on (a) collagen and (b) VWF surfaces. Individual participant results are plotted as symbols and the mean averages for each agonist condition per diagnosis are represented by bars. The symbols and bars are color-coded by diagnosis: green indicates no clinically-identifiable BD; red indicates VWD; black indicates QPD; blue indicates hypermobile EDS; and purple indicates BD, NOS. Participant 5 has thrombocytopenia in addition to QPD and this is indicated by open symbols. This assay was not performed for participant 10.

