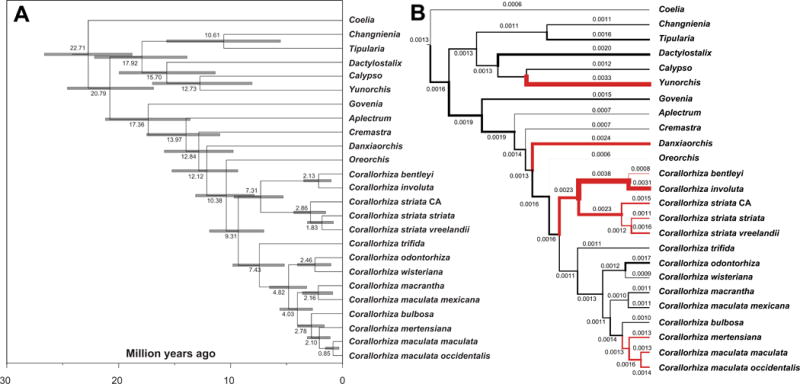
Fig. 4.

(a) Divergence time estimates from BEAST2 under an uncorrelated lognormal clock model (internal transcribed Spacer (ITS), matK, psaB, and rbcL), calibrated with fossils from Conran et al. (2009) and Poinar & Rasmussen (2017). Scale axis indicates millions of years before present. Node bars indicate the 95% Highest Posterior Density estimates. (b) Substitution rates per branch (substitutions·per site·per year) from BEAST2. Branch widths are scaled by substitution rate, and mean estimates are given for each branch. Red branches indicate putatively non-photosynthetic, fully mycoheterotrophic lineages.
