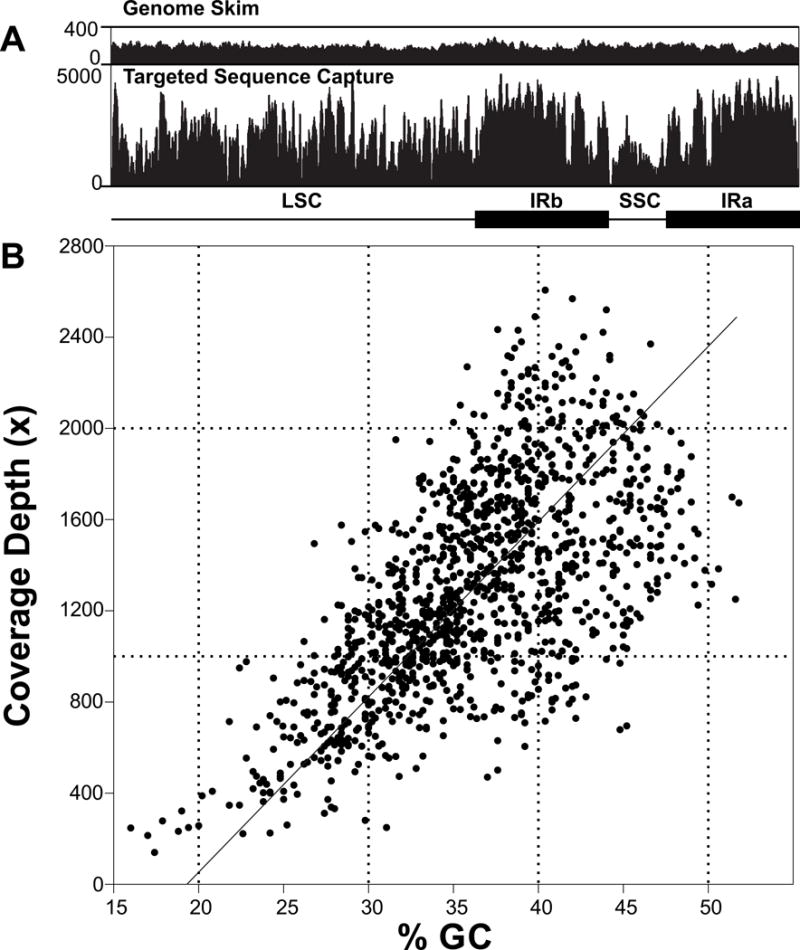
Fig. 6.

(a) Comparison of read coverage depth distribution across the entire plastome as a result of genome skimming (above) and targeted sequence capture (below), for Corallorhiza striata var. striata accession 350b OR. LSC, large single copy; SSC, small single copy; IR, inverted repeat. (b) The relationship between mean GC content and coverage depth across the plastomes of the C. striata complex for target capture data, based on a sliding window analysis. Slope of the best-fit line indicates the Pearson Correlation Coefficient (R = 0.634, P < 0.0001).
