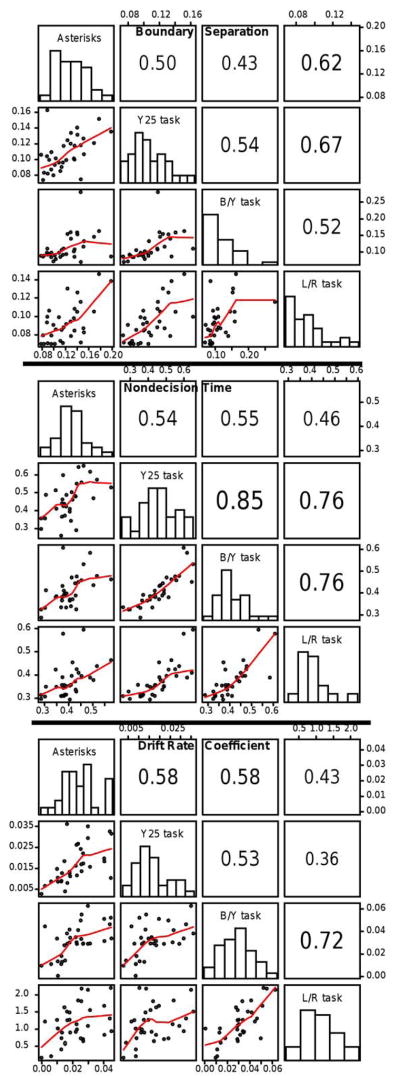
Figure 15.
Scatter plots, histograms, and correlations for boundary separation (top panel), nondecision time (middle panel), and drift rate coefficient (bottom panel) for the four tasks. Each dot represents an individual subject. The identity of the comparison in each off-diagonal plot or correlation is obtained from the task labels in the corresponding horizontal and vertical diagonal plots. The lines in the bottom left of the plots are lowess smoothers (from the R package).

