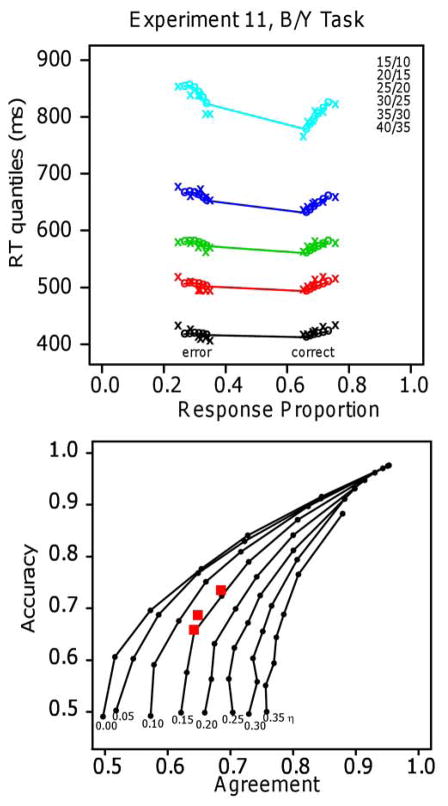
Figure 16.
Quantile probability plots for Experiment 11 (top panel) and a plot of accuracy against agreement between the two responses in the double pass procedure. Seven values of drift rate were used to produce each function (shown as the small dots on the lines) and 8 values of the standard deviation in drift rate across trials (η) were used to generate each function. The other model parameters were the means from the fits to the data. The red squares are values of accuracy plotted against agreement for the conditions of the experiment.

