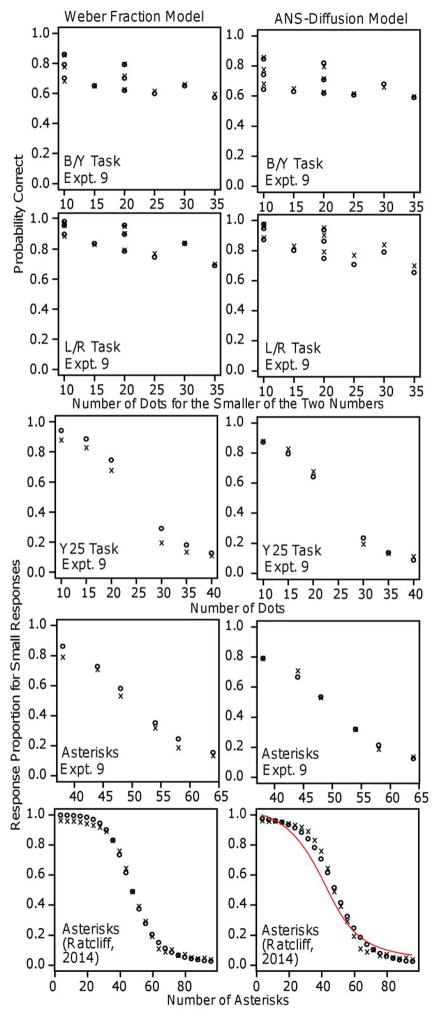
Figure 17.
Plot of accuracy against numerosity for the four tasks in Experiment 9 and the asterisks task in Ratcliff (2014, Experiment 1). The x’s are the data and the o’s are the predictions from the Weber fraction model (left column) and the diffusion model (right column). The red/thin line in the bottom right plot is from the log model fit.

