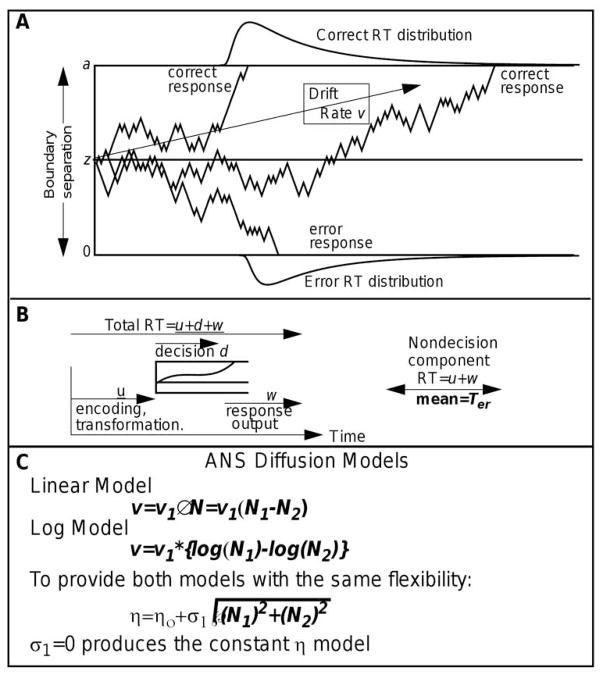
Figure 2.
A illustrates the diffusion decision model. B shows the additional components of the decision model that produce the total RT. C shows the standard assumption about drift rate and its variability across trials. D shows equations for drift rates and across trial SD in drift rate for the two ANS-diffusion models.

