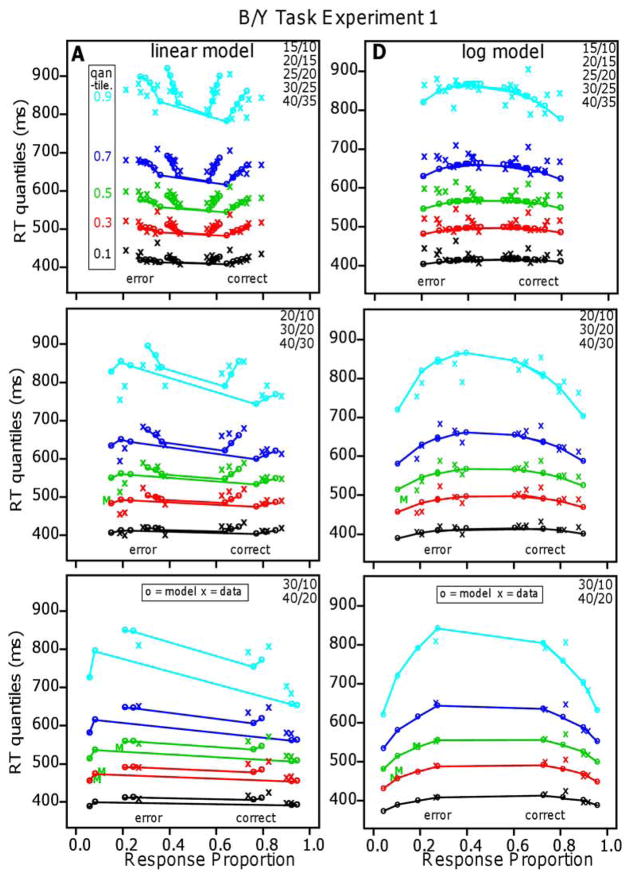
Figure 6.
Quantile-probability functions for Experiment 1 for the linear and log models. These plot RT quantiles against response proportions (correct responses to the right of 0.5 and errors to the left). The green/central lines are the median RTs. The number of dots in the conditions in the plots are shown in the top right corner and the more extreme functions are for proportional-area conditions and the less extreme for equal-area conditions.

