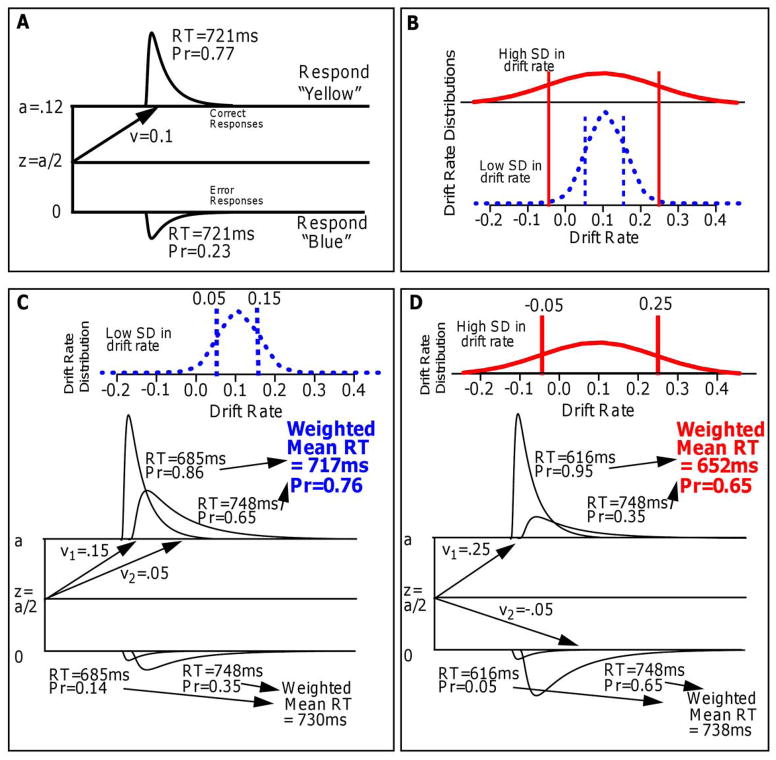
Figure 8.
An illustration of how the predictions of the linear model arise. A illustrates a single diffusion process with a single drift rate (with no across trial variability in drift rate). RT distributions for correct and error responses are equal if the starting point is equidistant from the boundaries. B shows distributions of drift rate (across trials) for high numerosity (wide red solid distribution) and low numerosity (narrow blue dashed distribution). To represent these distributions for illustration, two drift rates are chosen (v1 and v2 and accuracy is the average of the two accuracy values and mean RT is a weighted sum of the two RTs. C shows the averages for the low-SD condition and D shows the averages for the high-SD condition with the averages for correct responses shown in green. For completeness, error responses are also shown; note that for boundaries equidistant from the starting point, for a single drift rate, correct and error RTs are the same.

