Fig. 2.
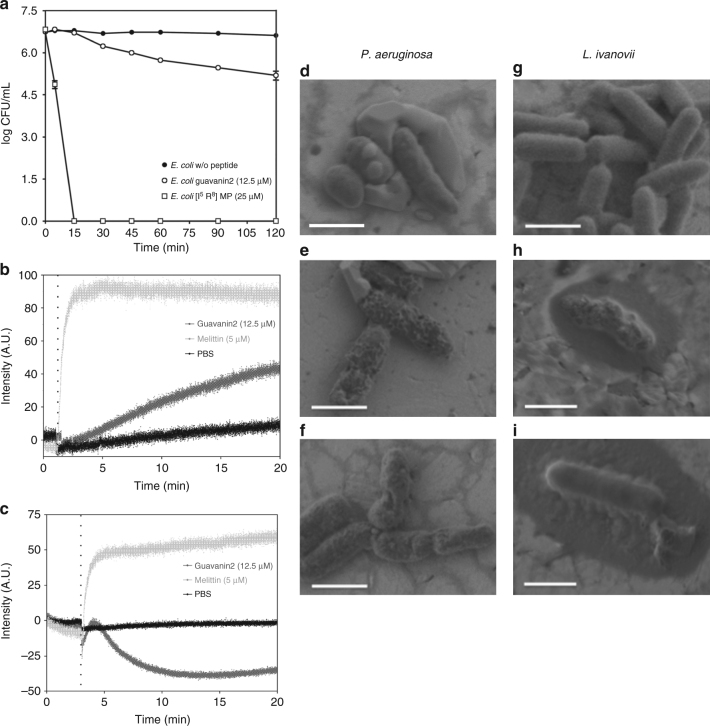
Killing and membrane effects of guavanin 2. a Time–kill profile of guavanin 2 against E. coli ATCC25922. Positive and negative controls correspond to bacteria incubated [I5, R8] mastoparan and without peptide, respectively. The data are the means ± S.E.M. of one experiments executed in triplicate. b, c Effect of guavanin 2 on plasma membrane integrity of E. coli ATCC 25922 cells after addition (vertical dotted line) of a concentration of peptide twofold above the MIC (12.5 µM). The pore-forming peptide melittin (5 µM) was used as a positive control. The negative control PBS corresponds to the bacteria incubated with the fluorescent probes without peptide. b Time-course cytoplasmic membrane permeation analysis of SYTOX Green uptake. cCytoplasmic membrane hyperpolarization using DiSC3(5). d SEM-FEG visualization of the effect of guavanin 2 on P. aeruginosa (d–f) and L. ivanovii (g–i). The Controls without peptide are displayed in the d, g panels, respectively. Bacteria were treated with a concentration of guavanin 2 corresponding to 25 µM (e), 50 µM (f, h) and 100 µM (i), respectively. Scale bar = 1 µm

