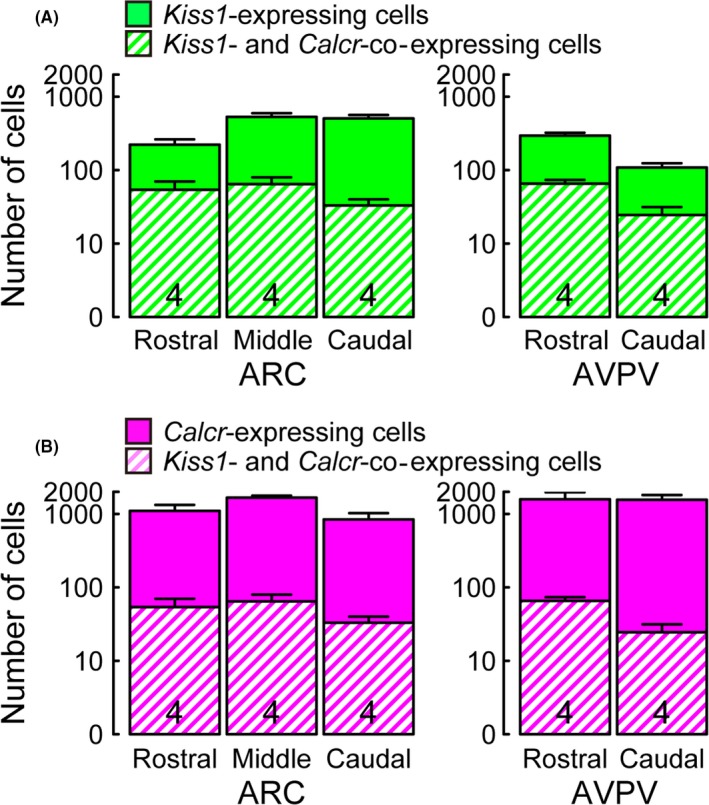
Figure 4.

Numbers of Kiss1‐ and Calcr‐expressing cells in the ARC or AVPV. The number of Kiss1‐expressing cells with or without Calcr expression in the ARC or AVPV in OVX+low E2 rats (A). The number of Calcr‐expressing cells with or without Kiss1 expression in the ARC or AVPV in OVX + low E2 rats (B). Values are mean ± SEM and are represented in a logarithmic scale on the Y‐axis. Numbers in each column indicate the number of animals used. The ARC was divided into three parts (from 1.8 to 2.6 mm, from 2.6 mm to 3.4 mm and from 3.4 to 4.2 mm posterior to the bregma) while the AVPV was divided into two parts (from 0.0 to 0.3 mm and from 0.3 to 0.6 mm posterior to the bregma)
