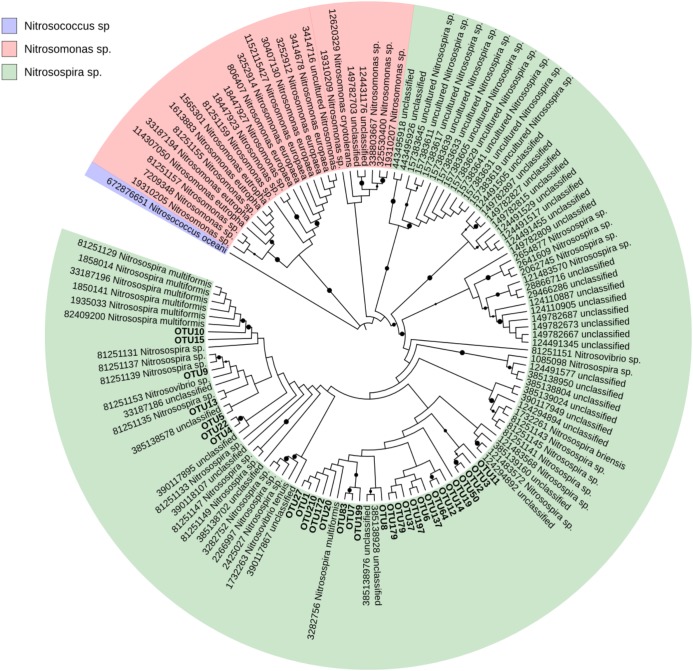
FIGURE 3.
Neighbor-joining tree of the 30 most abundant sample amoA-AOB OTUs and their nearest neighbors in the custom FunGene amoA sequence database. The NCBI taxonomic classification of the database entries is included. The outgroup is Nitrosococcus oceani. The percentage of replicate trees in which the associated taxa clustered together in the bootstrap test (1000 replicates) are shown next to the branches (black points mean bootstrap value >75%). Evolutionary distances were computed using the Maximum Composite Likelihood method. The analysis involved 131 sequences and 305 positions and was conducted in MEGA7.

