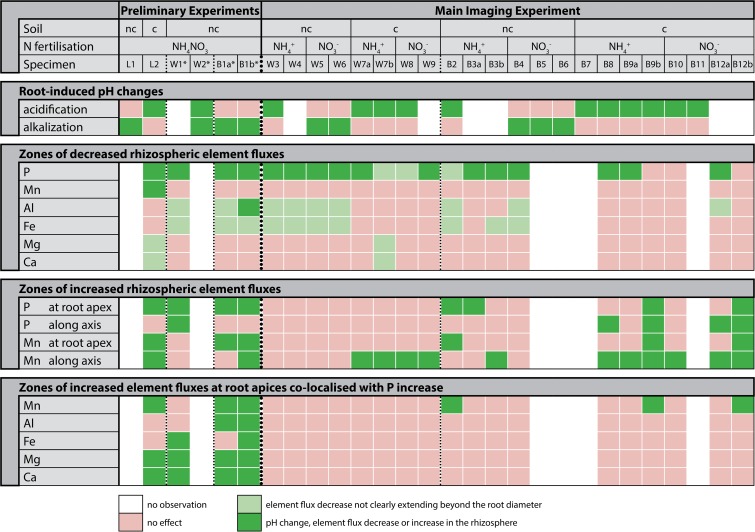
Fig. 2.
Overview on plant-induced changes in the rhizosphere. ‘L’: lupine; ‘W’: wheat; ‘B’: buckwheat. Columns between dashed lines contain data for the same plant species. ‘a’ and ‘b’ denote chemical images from different locations of one root system. ‘nc’ denotes non-calcareous soil, ‘c’ denotes calcareous soil. * denotes DGT deployment times of 24 h instead of the standard 6 h. Classification details for decreased element flux patterns not clearly extending beyond the root diameter (denoted in light green) and extending into the rhizosphere (denoted in dark green) is given in the M&M section

