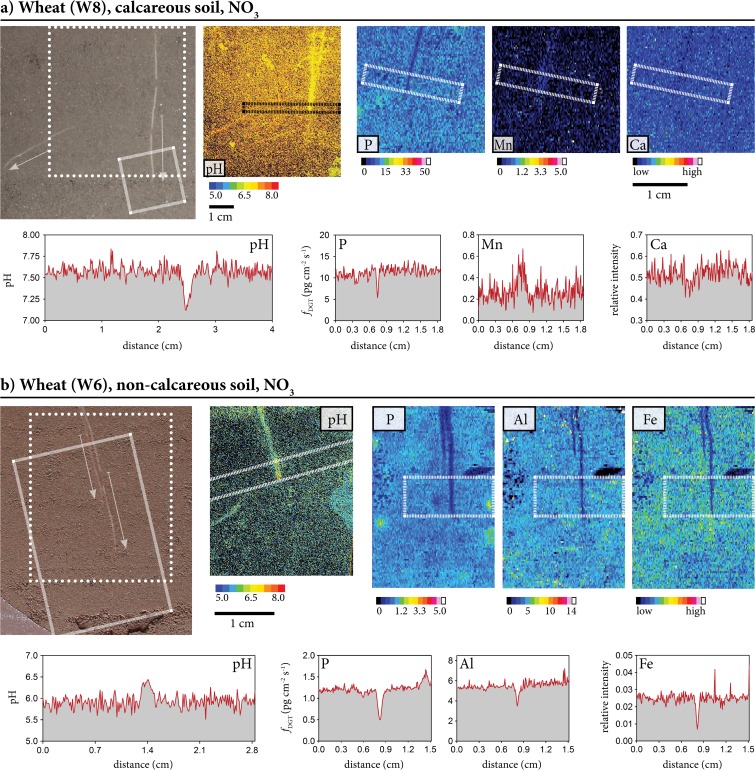
Fig. 3.
Characteristic patterns of labile element fluxes and pH in the rhizosphere. (a) Wheat grown on calcareous soil with NO3 fertilization, (b) wheat grown on non-calcareous soil with NO3 fertilization. Each image set contains a photograph of the root with arrows indicating root growth between the application times of the PO and DGT. Scale bars represent 1 cm; the smaller scale bar in pane (a) corresponds to the photo and the pH image, the larger one to the element images. The imaging areas for the PO are indicated with dotted lines in the photos, the imaging areas for DGT are indicated with dashed lines. Profiles show pH and elemental flux (pg cm−2 s−1). The long, rectangular boxes in the chemical images indicate the area used to calculate the profile plots by vertically averaging the single-pixel DGT fluxes. PO images were noise corrected (black pixels represent image noise where no pH-value could be assigned)

