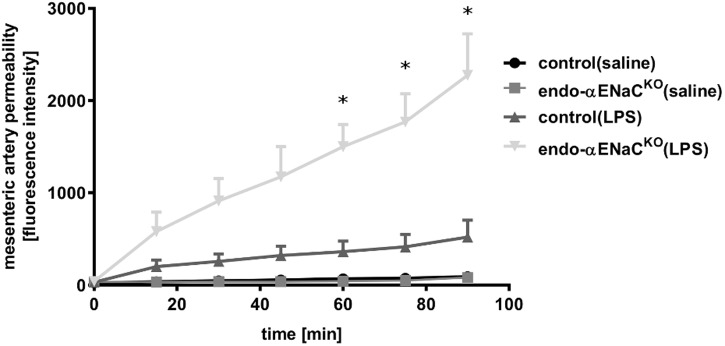
FIGURE 4.
Changes in fluorescence intensity in PSS buffer measured outside the cannulated vessel along 90 min of the perfusion from endo-αENaCKO and control mice in basal conditions and in endotoxemia (10 mg/kg, i.p., 12 h). FITC-dextran (150 kDa, 50 μg/ml) was administered as the contrast agent, control (saline) n = 7, endo-αENaCKO (saline) n = 6, control (LPS) n = 7, endo-αENaCKO (LPS) n = 6. Statistics: Kruskal–Wallis test followed by Dunn’s post hoc test (normality was assessed using the Kolmogorov–Smirnov test). The results are presented as the median with interquartile range, ∗p < 0.05.

