
FIGURE 3.
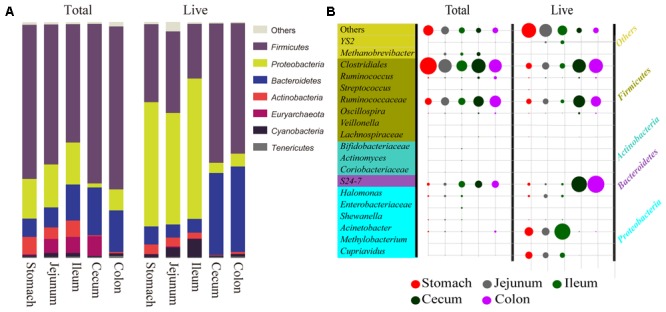
Comparison of predominant bacteria between total and live microbiota at two taxonomic levels. (A) Comparison of seven dominant bacteria at the phyla level in the two groups. The length of the bar corresponds to the relative bacterial abundance. (B) Comparison of 20 dominant bacteria at the genus level in the two groups. The size of the circle corresponds to relative bacterial abundance. “Total” represents total bacteria, the control; and “Live” represents live bacteria remaining after PMA treatment.