
FIGURE 4.
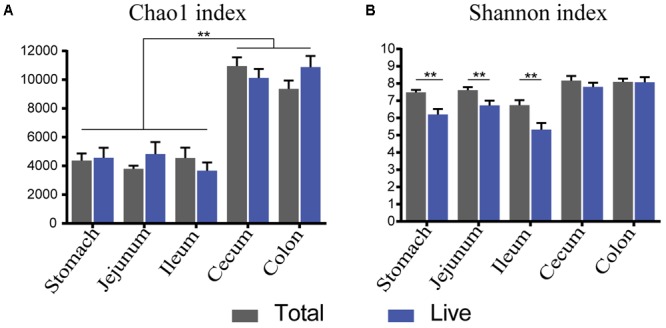
α-Diversity trends between total and live microbiota. Bar charts illustrate a comparison of diversity indices (A: Chao 1, B: Shannon index). ∗P < 0.05, ∗∗P < 0.01.
Official websites use .gov
A
.gov website belongs to an official
government organization in the United States.
Secure .gov websites use HTTPS
A lock (
) or https:// means you've safely
connected to the .gov website. Share sensitive
information only on official, secure websites.
α-Diversity trends between total and live microbiota. Bar charts illustrate a comparison of diversity indices (A: Chao 1, B: Shannon index). ∗P < 0.05, ∗∗P < 0.01.