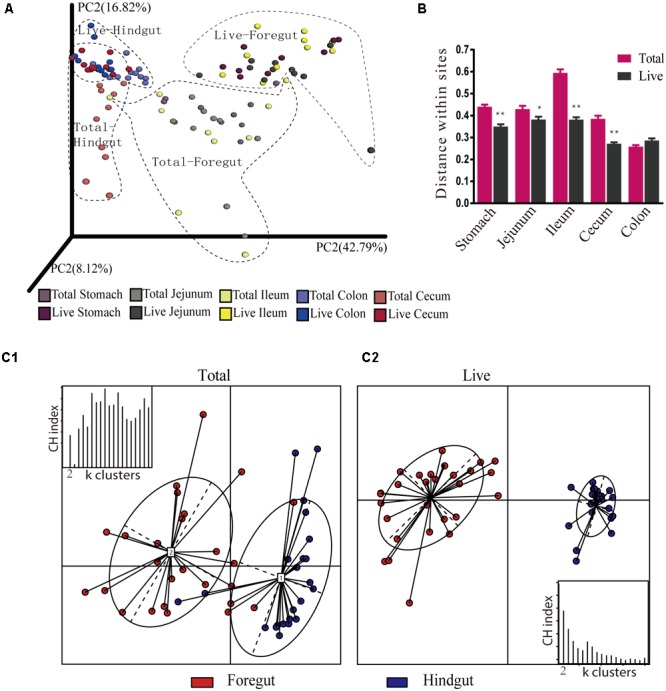
FIGURE 5.

Jackknifed β-diversity between total and live microbiota at OTU and genus levels. (A) Principal coordinate analysis (PCoA) of control and PMA-treated microbiota based on weighted UniFrac distances at the OTU level. Each point on the PCoA plots represents the average related location of the microbiota of each sample. (B) UniFrac distance within sites of total and live bacteria. (C) PCoA of control and PMA-treated microbiota based on JSD distance at the genus level. The nodes that exhibit an irregular ellipse cover are corresponding to the substructure of the gastrointestinal tract. CH index: Calinski-Harabasz Index; k clusters: partitioning around medoids (PAMs) clustering algorithm to cluster abundance profiles. ∗P < 0.05, ∗∗P < 0.01.
