
FIGURE 6.
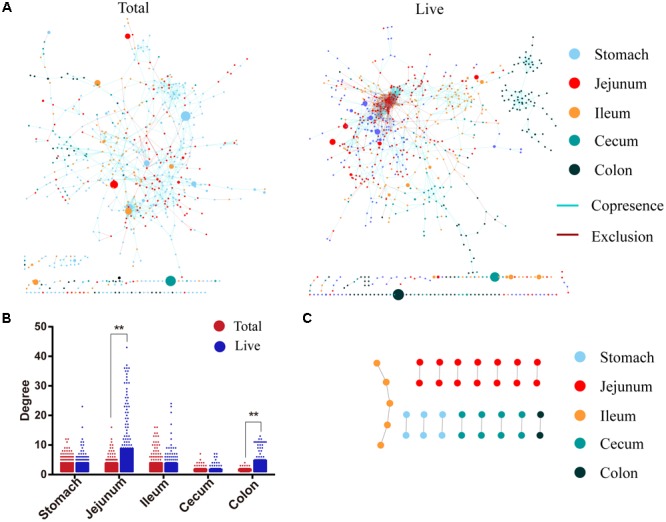
Different co-occurrence network. (A) Co-occurrence network of total and live microbiota. The connections represent a stronger correlation (Pearson: –0.52, Spearman: –0.62, Mutual information: 0.60, Bray–Curtis dissimilarity: 0.25, Kullback-Leibler dissimilarity: 0.49). Nodes represent taxa in the data sets. The size of each node is proportional to the relative abundance. (B) Node degree values associated with different digestive sites. (C) Intersection of both co-occurrence networks. ∗∗P < 0.01.