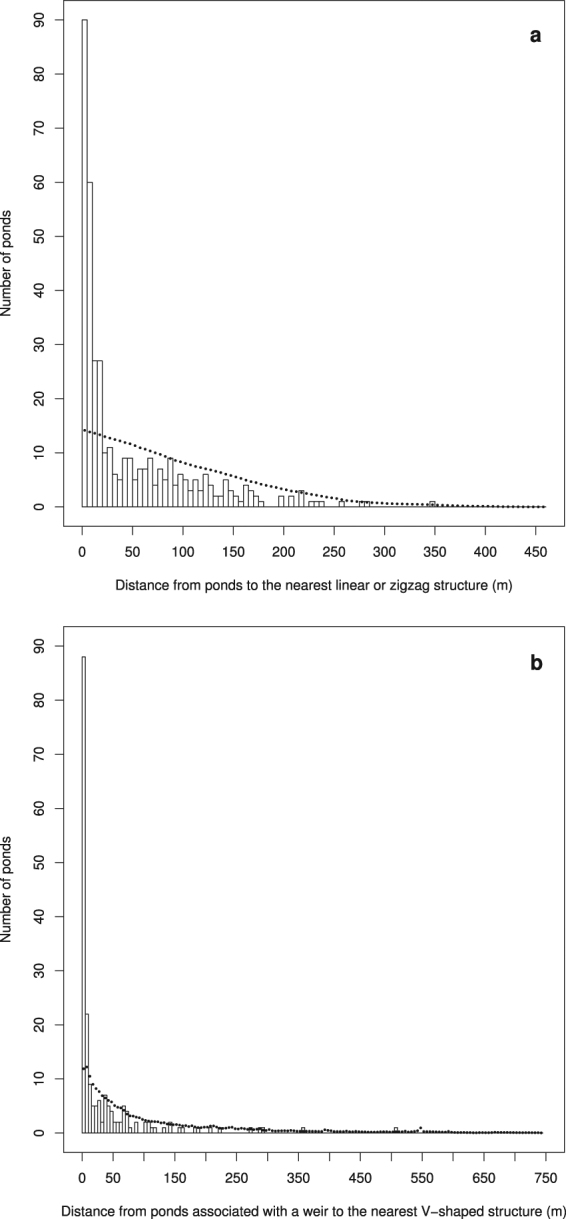
Figure 3.

Distribution of the distances between ponds and the nearest linear anthropogenic structure (causeway, canal or weir) (a), and between ponds associated with weirs and the nearest V-shaped structure (b). White bars represent the distribution of observed distances. Black dots represent the mean values for 10,000 simulated random distributions of the same number of ponds (vertical bars representing standard deviations do not exceed the radius of the dots and are not visible).
