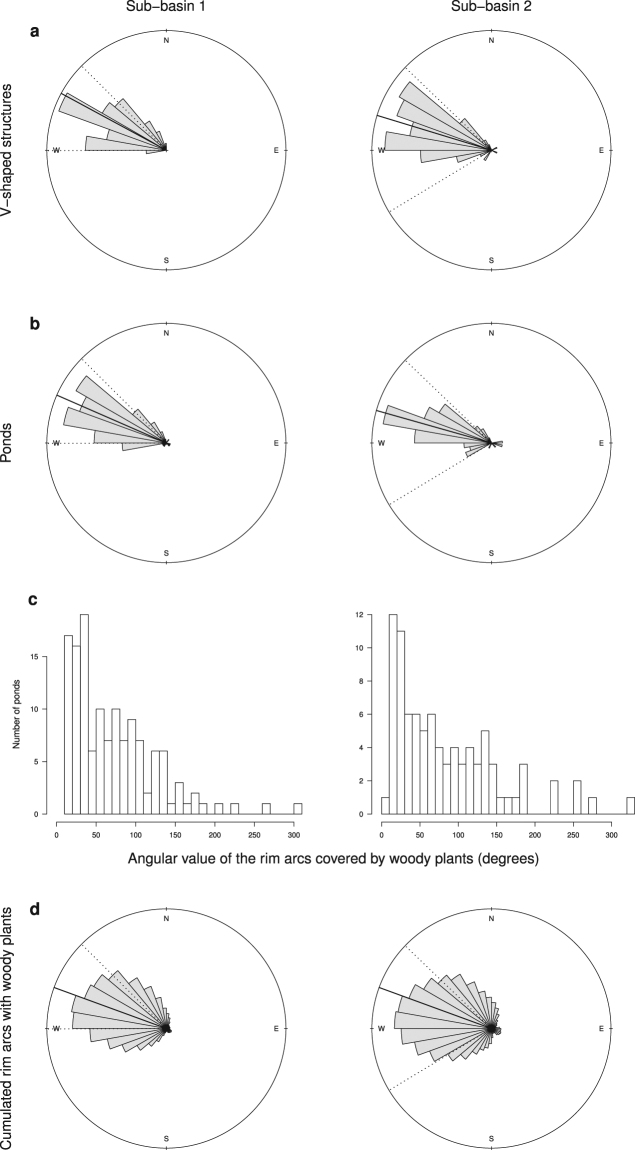
Figure 4.
Distribution of the orientation of V-shaped structures (from the widest part to the point of the V) (a) and of ponds (both those associated with linear structures and those that are isolated) from the lowest point in the centre to the highest point of the berm (b), in the two sub-basins. (c) Size distribution of the angle of the arc formed by woody plant presence around ponds. (d) Distribution of the orientation of rim arcs covered with woody plants, cumulated over all ponds. Solid lines represent the mean azimuth for each distribution. Dotted lines represent the extreme values of the putative direction of water flow during the high-water season for each sub-basin.

