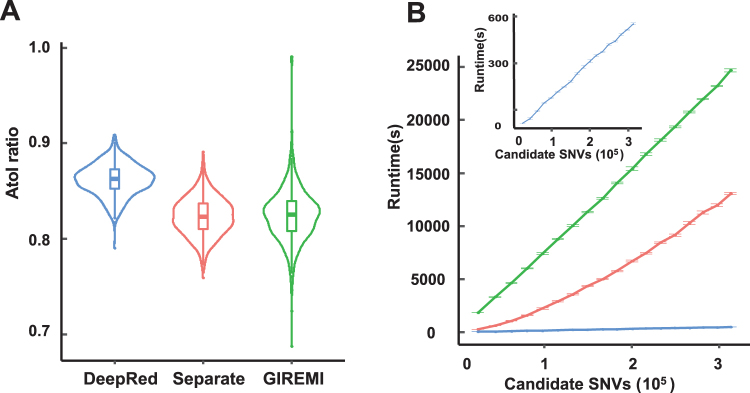
Figure 2.
Performance comparison of DeepRed with separate samples method and GIREMI method. (A) Violin plot of the A-to-I ratios identified by DeepRed, separate samples method, and GIREMI method for each individual in the Geuvadis dataset. The first, second (median), and third quartiles are illustrated in box-plot style. (B) The relationship between the candidate SNVs and runtime of RNA editing sites identified with DeepRed (blue), separate samples method (red), and GIREMI method (green). The insert plot represents the relationship between the candidate SNVs and runtime of RNA editing identified with DeepRed. Runtime refers to the time spent identifying RNA editing sites from candidate SNVs. Error bar represents the standard error of runtime across ten down sampling samples.

